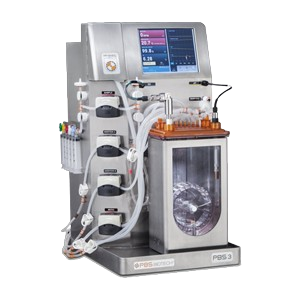
BioPure 3L
Bench-scale that behaves like commercial.
The 3L is the inflection point: identical hydrodynamics to the 80L commercial system, packaged for bench operation. Validate your process once and trust it at every subsequent scale.
Built for the bench-scale production stage.
1.8 – 3L working volume — true bench-scale stem cell production
Integrated touchscreen control with autopilot pump feedback
21 CFR Part 11 audit-trail compliant software
Sterile access ports for sampling, harvesting, and reusable sensors
Five reasons it beats incubation-based minis.
Higher yield, lower cost
Precise DO control overcomes the gas-exchange limits of incubation-based culture — extending the growth phase and doubling viable cell yield per batch.
2× cell yieldFull automation at mini scale
Large-scale automation packaged for development: real-time pH, integrated gassing, recipe building, and remote monitoring from day one.
Recipe + remoteClosed-system operation
Closed sampling, supplementation, and perfusion-based medium exchange — sterility preserved, operator variability eliminated.
Closed sterileSeamless path to scale
True scale-down model. The same Vertical Wheel hydrodynamics carry through 3L, 15L, and 80L GMP production with no re-engineering.
60 mL → 80 LPurpose-built for cell therapy
Engineered for shear-sensitive cells: PSC aggregate homogeneity, MSC viability, CAR-T phenotype — preserved from PD through GMP.
Phenotype safeFrom unboxing to inoculation in five steps.
- Step 01Calibrate
Enter vessel calibration data and prime sensors.
Ch. 6 · p. 63 - Step 02Install vessel
Mount single-use vessel; level adjust to 0 mL.
Ch. 6 · p. 66 - Step 03Prime & fill
Load tubing, prime pumps, dispense medium.
Ch. 6 · p. 76 - Step 04Ramp & inoculate
Set alarms to ramp, equilibrate, inoculate.
Ch. 6 · p. 87 - Step 05Sample / harvest
Sterile sampling, perfusion or harvest line.
Ch. 6 · p. 95
Every parameter you'll close-loop on day one.
Every part. Engineered for living cells.
Scroll to explode the vessel
Engineered for the room you'll put it in.
BioPure 3L vs. incubation-based mini bioreactors.
| Capability | BioPure 3L | Incubation-based minis |
|---|---|---|
| Real-time DO control | Closed-loop split-range | Not supported |
| Inline pH monitoring | Compendial-aligned | Offline only |
| Closed sampling & perfusion | Integrated | Not supported |
| Parallel cultures from one controller | Up to 24 vessels | Manual setup |
| Scale-down fidelity to GMP | Identical Vertical Wheel hydrodynamics | Geometry change required |
| Recipe automation & remote monitoring | Built-in | Not supported |
Audit-ready out of the crate.
USP Class VI / ISO 10993 contact materials
Gamma-irradiated single-use vessel (SAL 10⁻⁶)
BioLogic™ software — 21 CFR Part 11 audit trails
IQ / OQ documentation packages available
Validated for the modalities you're building.
Every day a cell therapy batch is delayed,
a patient's window closes.
Industry averages compiled from BioProcess International, Alliance for Regenerative Medicine, and PBS Biotech case studies. The Vertical-Wheel® is engineered so a process locked at PBS-3 transfers to PBS-80 without re-validation.
Model your manufacturing economics.
Adjust throughput, capex, and per-batch consumables to estimate cost per dose, annual savings, and payback period vs. your current process.